These 3 types of nonprofits spend the most on advertising according to this 2021 study

The Nonprofit Advertising Benchmark Study is a report from Whole Whale, a B Corp digital agency that works with nonprofit and social impact organizations. Whole Whale works with nonprofits and published this data to help organization leaders have a better idea of how to set their fundraising and advertising budgets. The data in the study comes from Cause IQ, the leading nonprofit data platform.
To create a large enough sample size for the data set, we looked at the IRS Form 990s of 7,171 U.S. 501(c)(3) organizations. The organizations we chose disclosed an annual revenue from 2018-2019 (filing years 2019 and 2020) of somewhere between $1 million and $10 million.
The data showed that 60% of nonprofits spend on advertising and promotion with a median annual spend of $12,067. How did we get this number? If you take all data for nonprofit advertising spend in this study and sort it from lowest to highest, the number in the middle—the median number—is $12,067. We primarily use median numbers in this study instead of average numbers since really high or really low numbers tend to skew the average.
Nonprofits that spend more money on advertising
Before we dive in, let’s clarify what this nonprofit advertising data can tell you. First, a limitation: The data we share in this study isn’t prescriptive. We can tell you how much nonprofits spend on advertising based on different factors, but that doesn’t necessarily mean your organization should spend that much as we don’t have data in this study that indicates the return on investment of this advertising spend.
Despite this limitation, the data included in this study can provide benchmarks that might be useful in informing how much your organization would like to spend on advertising. That’s why we call this study the Nonprofit Advertising Benchmark Study. We’ll tell you how much nonprofits spend on advertising based on factors like nonprofit type, size, founding year, and number of employees. This can give you an idea of what factors to consider when making your advertising budget.
In this post, we’ll focus specifically on benchmarks and insights based on the type or cause of nonprofits. Let’s start with the highest median annual ad spend.
Which nonprofits spend the most on advertising? These three nonprofit types are: Performing Arts Companies, Promoters of Performing Arts, Sports, and Similar Events, and Museums, Historical Sites, and Similar Institutions.
1. Performing Arts Companies
At the top is Performing Arts Companies. Organizations in this category include theater, dance, and musical groups. They have an annual median spend of $53,416. Nonprofits with a typical spend in this group include:

This image is from Music Worcester, a nonprofit that spent $53,416 on advertising in 2020. Their mission is to bring inspiring and varied musical experiences to expanding audiences through concerts, performances, and educational programs.
2. Promoters of Performing Arts, Sports, and Similar Events
Next in line with a median annual spend of $49,074 is Promoters of Performing Arts, Sports, and Similar Events. Nonprofits in this group organize, promote, and/or manage live performances and events. Nonprofits in this category include:

This image is from the Traverse City Film Festival, a nonprofit that spent $49,074 on annual advertising. Their mission is to show great movies that entertain and enlighten their audience.
3. Museums, Historical Sites, and Similar Institutions
Rounding out the top three is Museums, Historical Sites, and Similar Institutions with a median annual spend of $25,201. While the first two categories of nonprofits work on the performance and promotion of arts and sports, nonprofits in this category focus on the preservation and presentation of arts, culture, history, and nature. Nonprofits in this category include:

This image is from Yew Dell Botanical Gardens, a nonprofit that spent $27,733 annually on advertising. Their mission is to spark a passion for plants and gardening through accessible science and inspiring beauty.
There’s a clear overlap among the highest spenders: Their missions depend on a certain amount of audience attendance in physical or virtual spaces. Orchestras need listeners, agricultural expositions need spectators, and botanical gardens need observers.
What does this mean for you? If your revenue stream is contingent on audience attendance, you may want to consider allocating more advertising budget than usual to your overall fundraising budget. For example, a nonprofit that identifies as a Performing Arts Company spends a median of $51,458 more than the median for all nonprofits—that’s 2,628% higher for nonprofits in this category compared to all nonprofits.
Some nonprofits don’t spend on advertising
Does every nonprofit need to spend money on advertising? Not necessarily. In our study, we found that nonprofits in the Grantmaking and Giving Services category have a median annual ad spend of $0. You read that right: zero dollars.
Because this number reflects a median ad spend, some of the nonprofits in that category did spend money on advertising. This category includes 925 nonprofits; 74.8% did not allocate any money to advertising, which means 25.2% of nonprofits did. The average annual advertising spend for the group is $6,884.
Most of these nonprofits are foundations and healthcare research centers. Why don’t these nonprofits spend much on advertising? There’s a hint in their event fundraising spend; the median annual event fundraising spend for these nonprofits was $102,896. That’s 66% higher than the overall annual median event fundraising spend of $62,013.
Event fundraising spend for grantmaking nonprofits versus all nonprofits
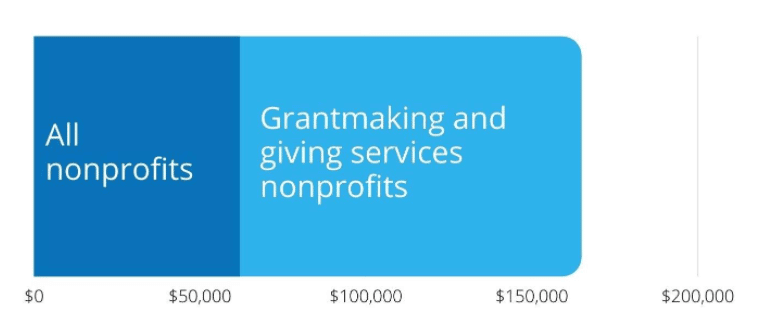
Grantmaking and Giving Services nonprofits spend $40,883 more on annual event fundraising than the median annual event fundraising spend for all nonprofits.
Grantmaking and Giving Services organizations spent a total of $13.19 million on event fundraising and made $40.45 million in income from those events. They only spent $6.17 million on advertising.
Takeaway: Consider your revenue source.
So, how much should your organization spend on advertising each year? Based on the data we shared in this post, it’s critical to consider your revenue source.
Do you rely on an audience buying tickets and attending your events? If so, look at your budget and see how it compares to the budgets of organizations like yours. Based on our data, they’re spending anywhere from $25,000-$53,000. How close are you to that advertising spend? Is it realistic that you consider upping (or lowering) your advertising spend to meet that range?
Does your nonprofit rely significantly on major donations? In that case, you may not need to spend any money on advertising. Instead, you can consider allocating more resources to event fundraising, where you can solicit those major donations.
No matter what decision you make, make sure it’s backed by industry data. You can view all seven of the insights and gain access to an interactive data studio dashboard in our Nonprofit Advertising Benchmark Study. Use this data to see how other organizations like yours are spending on advertising and event fundraising and get quantitative benchmarks for setting your own budget.

Schedule a live demo with Bloomerang, and we’ll show you how easy it is to create and automate reports, utilize online and offline fundraising tools, quickly integrate and access all your data, and ultimately create more time to engage your donors.