3 Simple Ways You Can Leverage Data for Better Fundraising

This post was originally published on re:charity.
You know that database of names, numbers, and notes that you dread working with because it’s so difficult to navigate? Yeah, that one. Well, you know what, that database is ripe for analysis.
It’s 2016. We live in an era of big data, visualization, and artificial intelligence. For-profit companies desperately rely on mining their databases to increase profits and boost ROI (return on investment). Why shouldn’t nonprofits at least scratch the surface?
It’s not fair to suggest that nonprofits should be doing advanced data analytics or super scientific predictive analysis. Performing evaluations like that tend to require expensive software or hiring an outside consultant. And, when we live in a society that perpetuates the “vicious cycle of fundraising,” most organizations can’t afford to invest a large sum of money for some “trendy data thing.”
But, there are a few simple and low cost ways to get some high-level analytics out of your donor database. This article highlights the three that our users at the Fundraising Report Card find most useful right off the bat. This is not to say that these three metrics are the most important — that differs for every organization and depends on the context and goal. But whether you’re a fundraiser, executive director, or board member, these metrics are a good place to start.
Let’s take a look!
Reactivation
Acquiring a new customer is more expensive than retaining an existing one. This basic business principle has been around since the beginning of trade and barter. It applies just as well to donors at your organization.
Maintaining relationships with your constituents is more cost-effective than marketing to get new ones. Retained donors also present opportunities to upgrade their giving each year. Not to mention that they have also been shown to be more likely planned giving prospects.
With that in mind, the first metric our users like to analyze is reactivation.
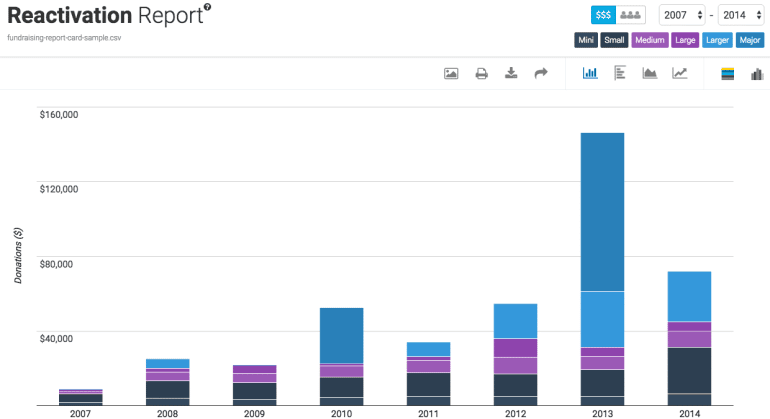
Reactivation is the number of ($) donations or (#) donors who previously lapsed but gave again this year to your organization. This segment of your donor database is unbelievably important.
First, they left, then they came back. Alarms bells should be going off in your head. What caused the donor to leave in the first place? What convinced them to come back in a future year? How can we influence that cycle of behavior?
A lot of our Fundraising Report Card users leverage this segment of donors for a targeted engagement campaign. For example, one executive director mentioned that her annual fund team was going to send a thank-you postcard to all of their reactivated donors in their under $1000 segments.
I’m no marketing guru — I’m the data guy, but I can tell you that engaging, thanking, and interacting with reactivated donors is a great way to help boost retention and learn more about your constituents.
Lapsed
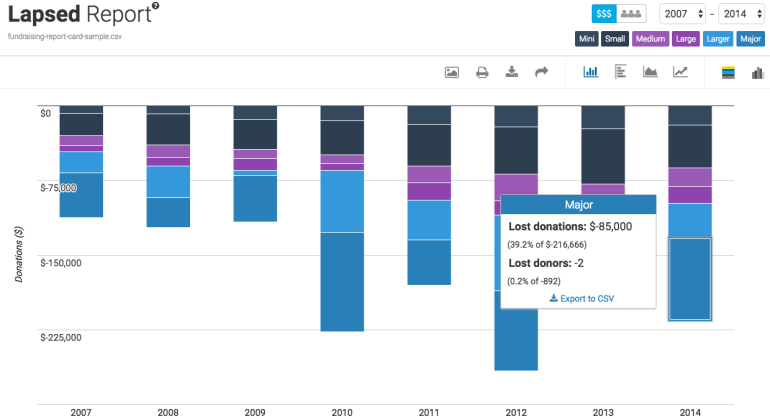
Another crucial report to analyze is of lapsed donors and gifts. What is great (or not so great) about lapsed analysis is the fact that it presents opportunities.
Think of lapsed donors from the for-profit mindset.
Imagine a new Italian restaurant opened up down the street from your home. You and your family go for dinner one night. The service was good, but the food was a little off, and you don’t plan on returning anytime soon. You just lapsed.
A few weeks later though, you get a coupon in the mail. You and the family decide to take one more chance on the restaurant. The food was a little better and everyone was satisfied. The new Italian spot has officially been added to your, “we all like this restaurant” list. You just reactivated.
Now bring this back to your nonprofit. Lapsed donors can help your organization in two crucial ways.
First, by engaging with donors who have left you can answer that pesky question, “why did they leave?” And second, you can try to reactivate those previously engaged individuals.
One of our users at the Fundraising Report Card shared a great idea for how she leveraged her lapsed report.
This fundraiser pitched the idea of sending a short, online survey to her under $500 lapsed donors via email. The goal was to learn what the organization did well and what they could do to improve their donors’ experience.
She paired this with a phone call to lapsed donors in her $500-$1000, $1000-$5000, and $5000 and up segments. She had the same goal, but simply used a more one-to-one platform.
Targeting your outreach to lapsed donors can prove unbelievably efficient. Reactivating and retaining previously lapsed donors is a great way to increase donor lifetime value while keeping donor acquisition costs relatively low. And the great thing about it all is that you no longer have to spend a week in Excel trying to figure out who your lapsed donors are — that’s why we made the Fundraising Report Cardto help.
Donor lifetime value
The third and final metric that our users find most informative straight away is donor lifetime value
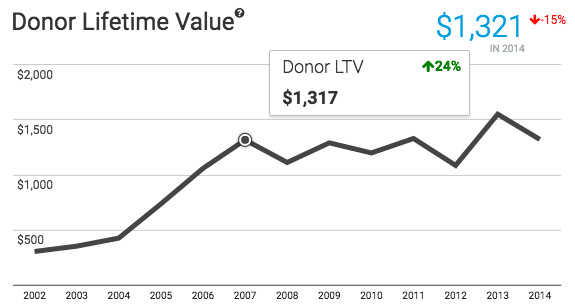
Lifetime Value or LTV is a prediction of how much money you can expect to receive from a donor before they churn (lapse).
The Lifetime value calculation is simple, but it relies on a few other metrics that can be tricky to calculate. Donor lifespan, average donation amount, and frequency of donation (the number of gifts a donor leaves in one year).
The formula ends up looking something like this:
Lifespan × Average donation amount × (Total # of donations ÷ Total # of donors) = LTV
A lot of our Fundraising Report Card users use the reactivation and lapsed reports to help segment their marketing, and then use the LTV metric to measure their effectiveness.
The goal is that by improving your marketing and appeals you will be able to increase donor LTV. Overtime, you should be able to see trends and patterns emerge in LTV. Hopefully up and to the right!
If LTV is going up then you know you can afford to spend a little bit more to acquire and retain your donors. But if LTV is going down then it may be a warning sign of a fundraising department out of balance.
One of the things that our users have mentioned to us at the Fundraising Report Card is that LTV is useful, but that segmented LTV would be even more powerful. Segmenting LTV by donor giving level (under $100, $100-$250, etc.) would remove outliers and provide a more true metric to measure.
Fortunately, we are working on adding that soon. But in the meantime, calculating, tracking and setting goals for overall LTV is a great place to start.
There are hundreds of fundraising metrics–the three that I just covered are the tip of the iceberg.
Over time, as you and your colleagues get more comfortable with your data you can dive into more granular reports. But, for now, these three reports and metrics are a great starting point.
Special Offer
As a Kindful reader, you can get 10% your Fundraising Report Card subscription with promo code “kindful”.
Zach Shefska is Product Manager at the Fundraising Report Card, a division of MarketSmart. The Fundraising Report Card is a free tool that empowers fundraisers to make data-driven fundraising decisions.
Schedule a live demo with Bloomerang, and we’ll show you how easy it is to create and automate reports, utilize online and offline fundraising tools, quickly integrate and access all your data, and ultimately create more time to engage your donors.